文章目录
实验所用教材配图资源:数字图像处理-冈萨雷斯-第三版(教材配图)
实验Matlab代码资源:数字图像处理 第三章 灰度变换与空间变换(Matlab实验代码)
一、灰度变换:图像反转 P65
1.1 实验内容
对原图像各像素进行灰度集内的反转变换
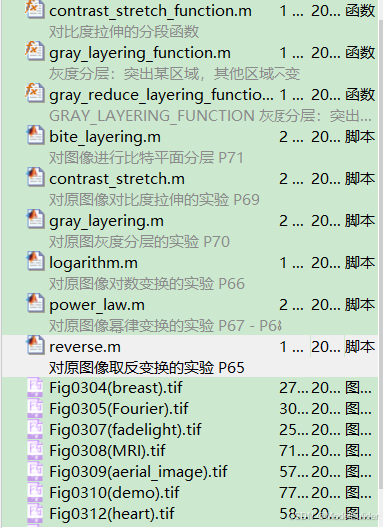
1.2 目录结构
1.3 Matlab代码
% 对原图像取反变换的实验 P65
close all;clear all;clc
% 读入图片
r = imread('Fig0304(breast).tif');
% 在灰度集中取反
L = 256;
s = L - 1 - r;
% 显示图片
figure;
subplot(1,2,1);
imshow(mat2gray(r));
title('原始数字乳房X射线照片');
subplot(1,2,2);
imshow(mat2gray(s));
title('反转后的原始数字乳房X射线照片')
1.4 实验结果
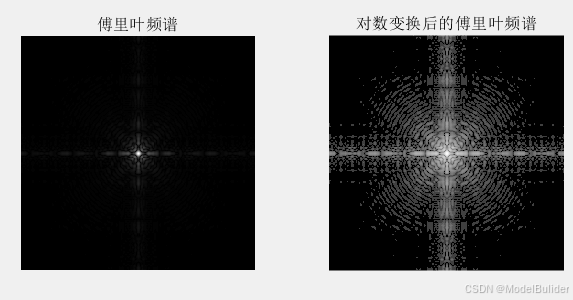
二、灰度变换:对数变换 P66
2.1 实验内容
对原图像各像素进行灰度集内的对数变换
2.2 目录结构
2.3 Matlab代码
% 对原图像对数变换的实验 P66
close all;clear all;clc
%{


    变换函数
 s = c * log(r+1)
为保证变换前后后的图像的灰度级不变,使
c = (L - 1) / log(L)
%}

% 1、读入原图片,imread()函数的返回值类型在数学上为矩阵
r = imread('Fig0305(Fourier).tif');
% 2、对数变换
% ① 设置原图的灰度级
L = 256;
% ② 设置对数变换函数中的常数c
c = (L - 1)  / log(L);
% c = 1;
% mat2gray(),用于将矩阵转换为灰度图
s = mat2gray(c * log(double(r) + 1));

figure;
subplot(1,2,1);
imshow(r);
title('傅里叶频谱');
subplot(1,2,2);
imshow(s);
title('对数变换后的傅里叶频谱');
2.4 实验结果
三、幂律变换 P67 - P68
3.1 实验内容
对原图像各像素进行灰度集内的幂律变换
3.2 目录结构
3.3 Matlab代码
% 对原图像幂律变换的实验 P67 - P68
close all;clear all;clc

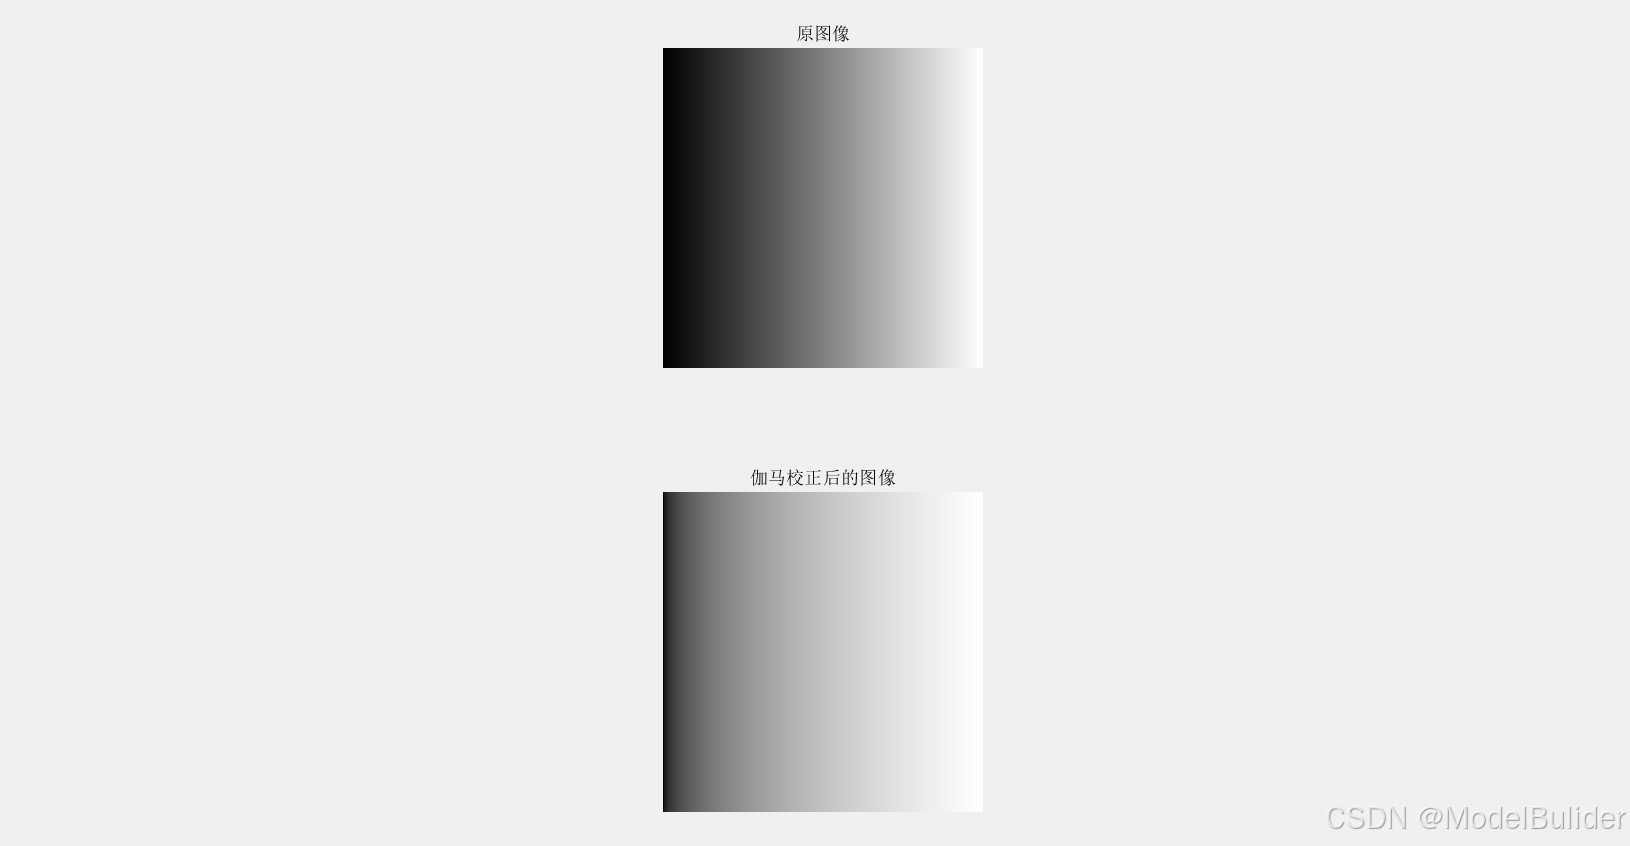
% 亮度斜坡实验
% 导入亮度斜坡图片
r = imread('Fig0307(fadelight).tif');
% 伽马校正
s = mat2gray(double(r).^0.4);
s

% 显示图像
figure('name','亮度斜坡');
subplot(2,1,1);
imshow(r);
title('原图像')
subplot(2,1,2);
imshow(s);
title('伽马校正后的图像');

% 人体脊椎骨折的核磁共振图像(MRI)
r = imread('Fig0308(MRI).tif');
% 伽马校正
s_0_6 = mat2gray(double(r).^0.6);
s_0_4 = mat2gray(double(r).^0.4);
s_0_3 = mat2gray(double(r).^0.3);
% 显示图像
figure('name','人体脊椎骨折的核磁共振图像(MRI)');
subplot(1,4,1);
imshow(r);
title('人体脊椎骨折的核磁共振图像(MRI)')

subplot(1,4,2);
imshow(s_0_6);
title('伽马取0.6,校正后的图像');

subplot(1,4,3);
imshow(s_0_4);
title('伽马取0.4,校正后的图像');

subplot(1,4,4);
imshow(s_0_3);
title('伽马取0.3,校正后的图像');

% 航拍图
r = imread('Fig0309(aerial_image).tif');
% 伽马校正
s_3 = mat2gray(double(r).^3);
s_4 = mat2gray(double(r).^4);
s_5 = mat2gray(double(r).^5);
% 显示图像
figure('name','航拍图');
subplot(1,4,1);
imshow(r);
title('航拍图')

subplot(1,4,2);
imshow(s_3);
title('伽马取3,校正后的图像');

subplot(1,4,3);
imshow(s_4);
title('伽马取4,校正后的图像');

subplot(1,4,4);
imshow(s_5);
title('伽马取5,校正后的图像');
3.4 实验结果
四、灰度变换:分段线性变换—对比度拉伸 P69
4.1 实验内容
对原图像各像素进行灰度集内的对比度拉伸
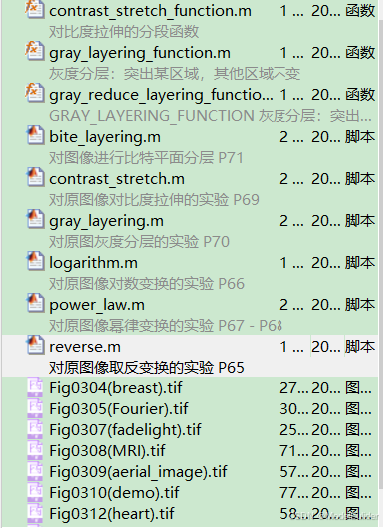
4.2 目录结构
4.3 Matlab代码
- 编写业务的代码
% 对原图像对比度拉伸的实验 P69
close all;clear all;clc
% 读入图片
r = imread('Fig0310(demo).tif');
% 进行对比度拉伸
L = 256;
L = L - 1;
[row,column] = size(r);    % 读取行r、列c
s_contrast = double(zeros(row,column));
for i = 1:row        % 建立for循环嵌套
    for k = 1:column
        s_cell = double(r(i,k));
        s_contrast(i,k) = contrast_stretch_function(s_cell);
%         if s_cell < (3.0 * L / 8)
%             s_contrast(i,k) = 1.0 * s_cell / 3;
%         elseif (s_cell > (3.0 * L / 8)) && (s_cell < (5.0 * L / 8))
%             s_contrast(i,k) = 3.0 * s_cell - L;
%         else
%             s_contrast(i,k) = 1.0 * (L - 8) * s_cell / (8 * L - 13) + (7 * L - 5) * (L - 1) / (8 * L - 13);
%         end

    end
end
% s_contrast = mat2gray(s_contrast);

% 进行阈值处理
s_switch = zeros(row,column);
for i = 1:row        % 建立for循环嵌套
    for k = 1:column
        s_cell = r(i,k);
        if s_cell < ((L + 1) * 3.4 / 8)
            s_switch(i,k) = 0;
        else
            s_switch(i,k) = L;
        end
    end
end
s_switch = mat2gray(s_switch);


% 显示图片
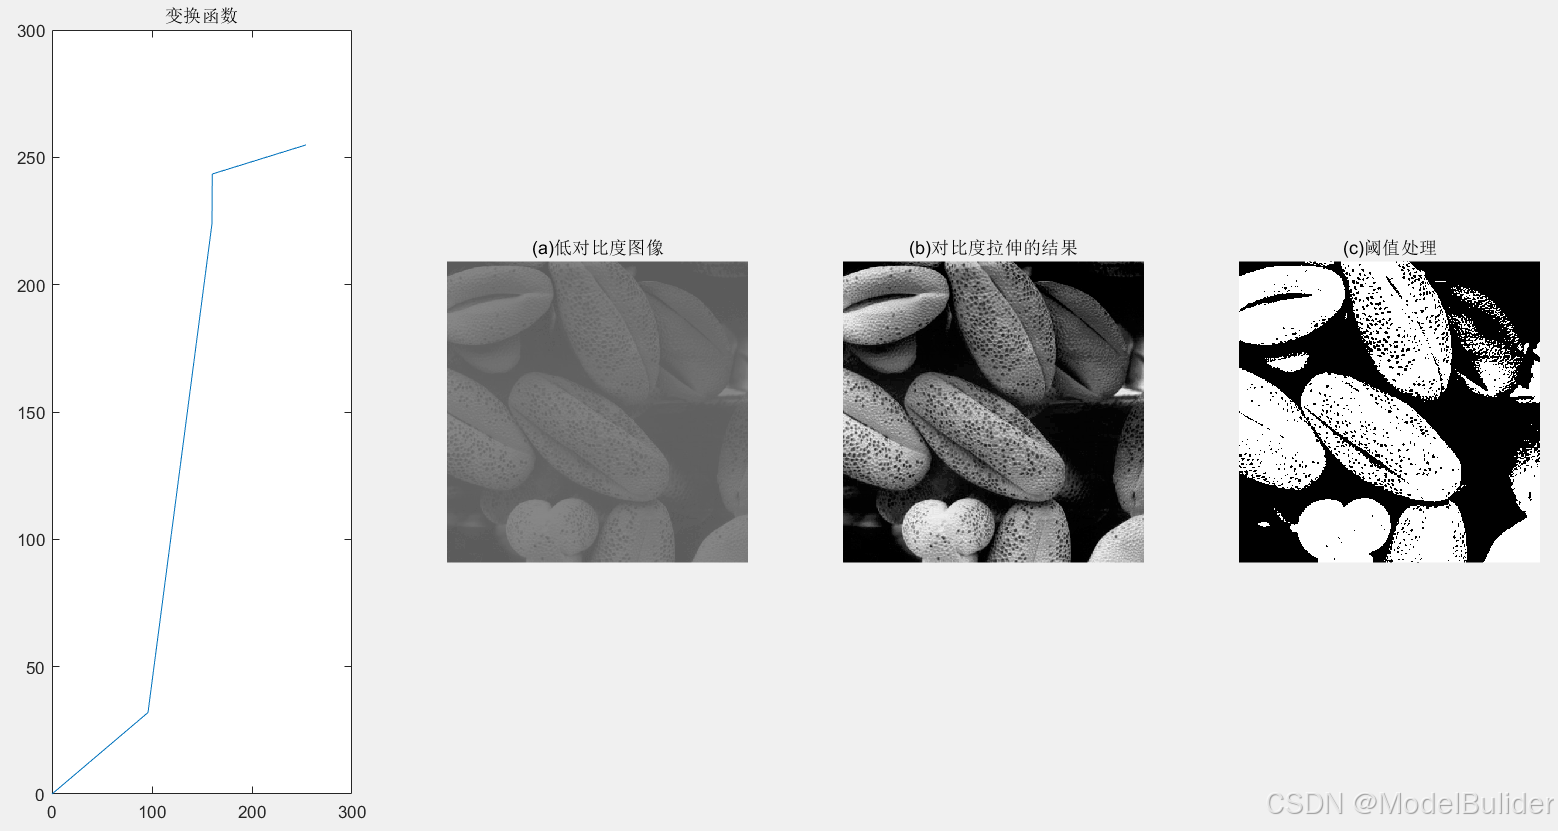
figure('name','对比度拉伸')
subplot(1,4,1);
x = 0:0.001:(L-1);
plot(x,contrast_stretch_function(x));
title('变换函数');


subplot(1,4,2);
imshow(r);
title('(a)低对比度图像');

subplot(1,4,3);
imshow(mat2gray(s_contrast));
title('(b)对比度拉伸的结果');

subplot(1,4,4);
imshow(s_switch);
title('(c)阈值处理');
- 包含的函数代码
function y = contrast_stretch_function(x)
%对比度拉伸的分段函数
%   此处显示详细说明
L = 256;
[~,column] = size(x);
y = double([]);
for c = 1:column
    s_cell = x(c);
    if s_cell >= 0 && (s_cell <= (3.0 * L / 8))
        temp = s_cell / 3.0;
    elseif (s_cell > (3.0 * L / 8)) && (s_cell <= (5.0 * L / 8))
        temp = 3.0 * s_cell - L;
    else
        temp = 1.0 * (L - 8) * s_cell / (8 * L - 13) + (7 * L - 5) * (L - 1) / (8 * L - 13);
    end
    if column == 1
        y = temp;
    else
        y(end+1) = temp;
    end
end
end
4.4 实验结果
五、灰度变换:灰度分层 P70
5.1 实验内容
对原图像各像素进行灰度集内的灰度分层
5.2 目录结构
5.3 Matlab代码
- 业务逻辑的
% 对原图灰度分层的实验 P70
close all;clear all;clc;
% 读入图片
r = imread('Fig0312(heart).tif');
% 处理图片
% ① 突出某一范围,降低其他范围的灰度
L = 255;
[row,column] = size(r);
s_1 = double(zeros(row,column));
for i = 1:row
    for j = 1:column
        s_cell = r(i,j);
        s_1(i,j) = gray_reduce_layering_function(s_cell);
    end
end

% ② 突出某一范围,保持其他范围的灰度不变
s_2 = zeros(row,column);
for i = 1:row
    for j = 1:column
        s_cell = r(i,j);
        s_2(i,j) = gray_layering_function(s_cell);
    end
end

% 显示图像
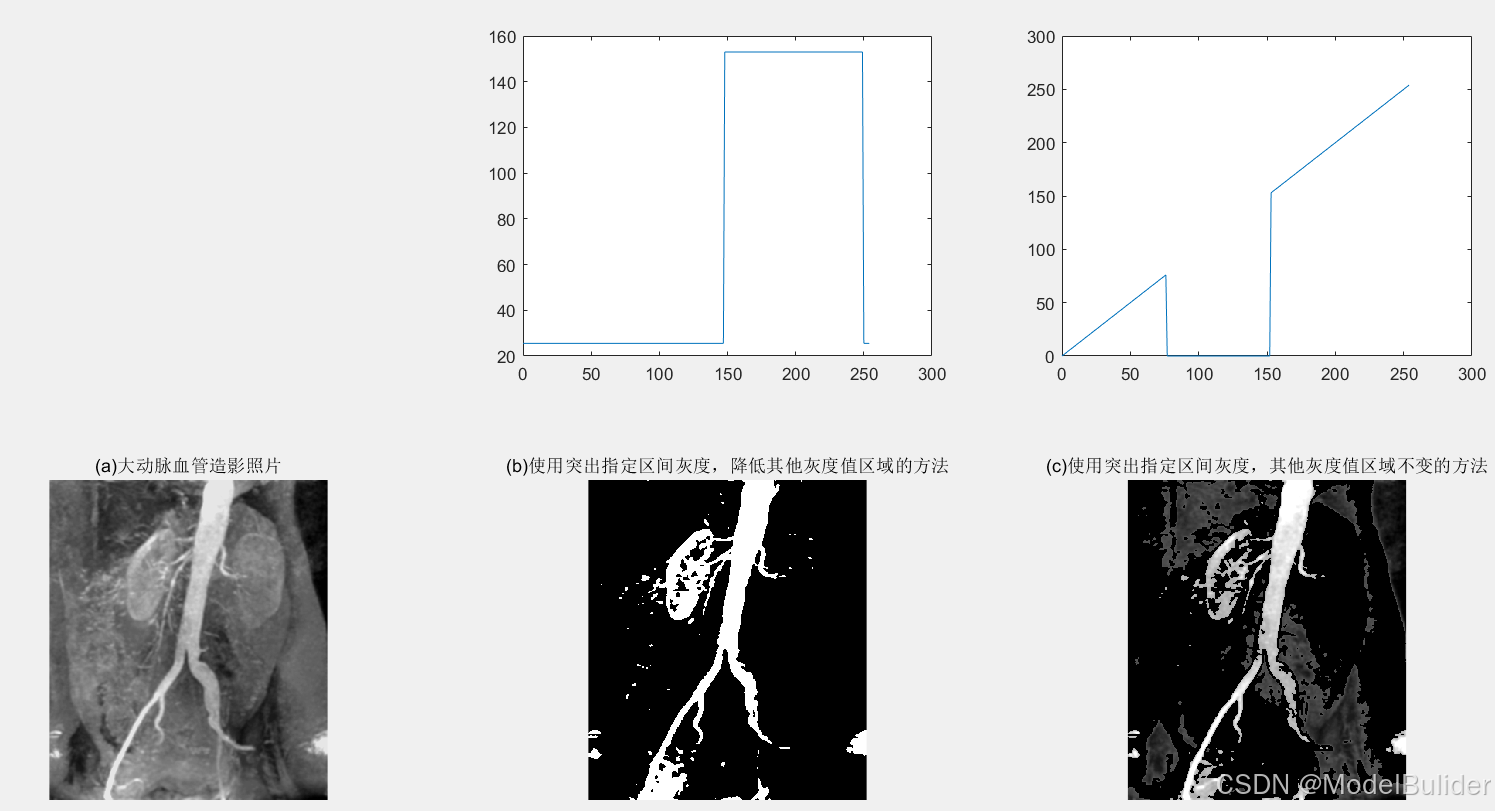
figure('name','大动脉血管造影图片')
subplot(2,3,2);
x = 0:1:(L-1);
plot(x,gray_reduce_layering_function(x));

subplot(2,3,3);
plot(x,gray_layering_function(x));

subplot(2,3,4);
imshow(r);
title('(a)大动脉血管造影照片');

subplot(2,3,5);
imshow(mat2gray(s_1));
title('(b)使用突出指定区间灰度,降低其他灰度值区域的方法');

subplot(2,3,6);
imshow(mat2gray(s_2));
title('(c)使用突出指定区间灰度,其他灰度值区域不变的方法');
- 包含的函数
% 函数①
function y = gray_reduce_layering_function(x)
%灰度分层:突出某区域,其他区域均降低值
%   此处显示详细说明
L = 255;
[~,column] = size(x);
y = double([]);
for i = 1:column
    s_cell = x(i);
    if s_cell > (2.9 * L / 5) && s_cell < (9.8 * L / 10)
        temp = 3.0 * L / 5;
    else
        temp = 1.0 * L / 10;
    end
    if column == 1
        y = temp;
    else
        y(end+1) = temp;
    end
end
end
% 函数②
function y = gray_layering_function(x)
%GRAY_LAYERING_FUNCTION 灰度分层:突出某区域,其他区域不变
%   此处显示详细说明
L = 255;
[~,column] = size(x);
y = double([]);

for c = 1:column
    s_cell = x(c);
    if s_cell > (3 * L / 10) && s_cell < (3.0 * L / 5)
        temp = 0;
    else
        temp = s_cell;
    end
    if column == 1
        y =temp;
    else
        y(end+1) = temp;
    end
end
end
5.4 实验结果
六、灰度变换:比特分层 P71
6.1 实验内容
对原图像各像素进行灰度集内的比特分层
6.2 目录结构
6.3 Matlab代码
% 对图像进行比特平面分层 P71
close all;clear all;clc;
% 读入图片
r = imread('Fig0314(dollar).tif');
% 图片比特分层
L = 256;
[row,column] = size(r);
% 细胞数组,可以保存不同的数据结构,也可直接对细胞内元素进行修改
s_layers = {

      };
for i = 1:8
    s_layers{

      end+1} = zeros(row,column);
end

% 分离比特层
for i = 1:row
    for j = 1:column
        s_cell = r(i,j);
        s_str = dec2bin(s_cell,8);

        for n = 8:-1:1
            if s_str(n) == '1'
                s_layers{

      9 - n}(i,j) = 1;
            end
        end

    end
end

% 显示图像
figure;
subplot(3,3,1);
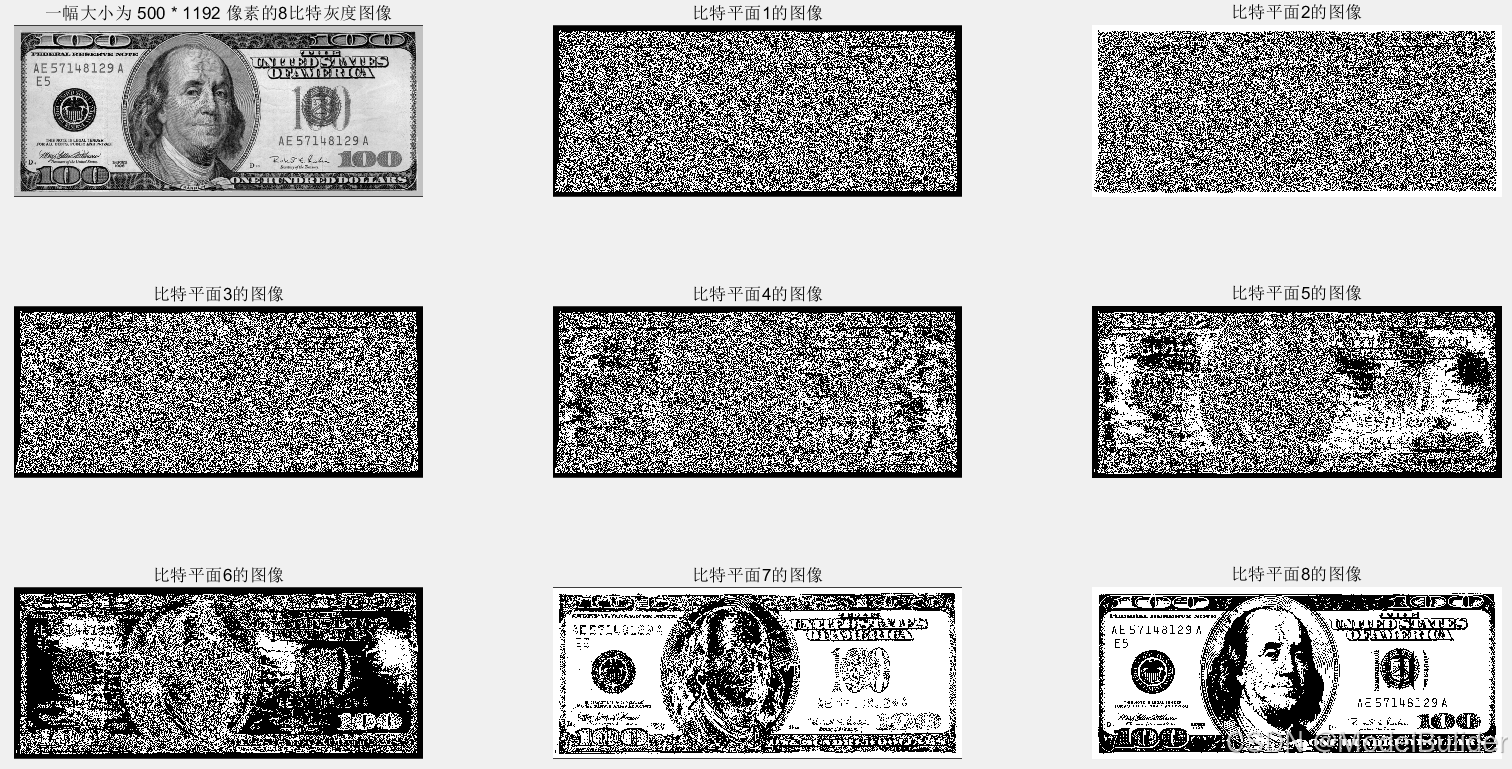
imshow(r);
title('一幅大小为 500 * 1192 像素的8比特灰度图像');

for i = 1:8
    subplot(3,3,i+1);
    imshow(mat2gray(s_layers{

      i}),[0 1]);
    title(['比特平面',num2str(i),'的图像']);
end


% 重建图像
s_rebuild_8 = 128 * s_layers{

      8};
s_rebuild_7 = 64 * s_layers{

      8};
s_rebuild_6 = 32 * s_layers{

      6};
s_rebuild_5 = 16 * s_layers{

      5};

figure('name','重建图像');
subplot(1,3,1);
s = s_rebuild_8 + s_rebuild_7;
imshow(mat2gray(s));
title("使用比特平面8和7的图像");

subplot(1,3,2);
s = s + s_rebuild_6;
imshow(mat2gray(s));
title("使用比特平面8,7和6的图像");

subplot(1,3,3);
s = s + s_rebuild_5;
imshow(mat2gray(s));
title("使用比特平面8,7,6和5的图像");
6.4 实验结果
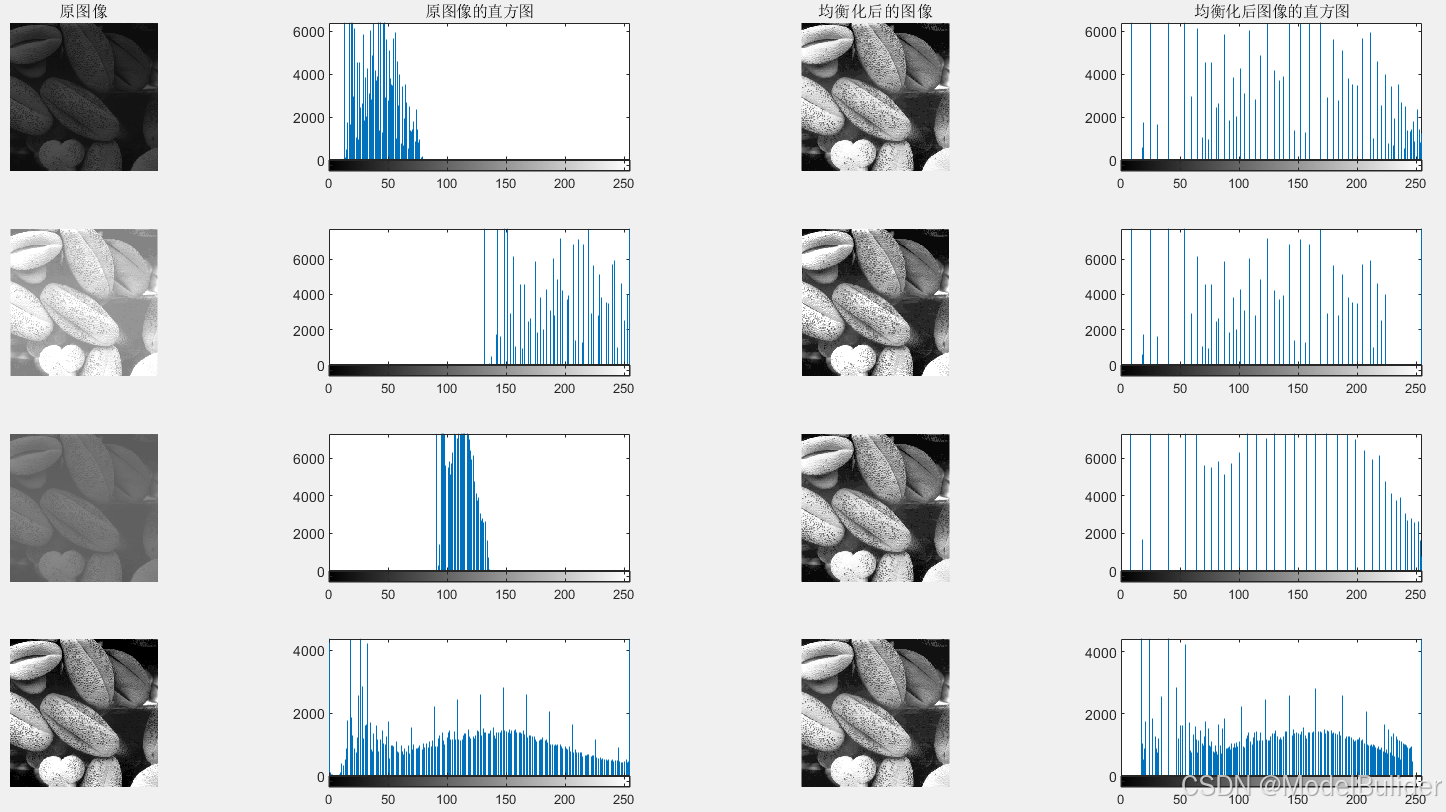
七、直方图均衡 P77
7.1 实验内容
对图像每个像素进行处理,使最终图像表现为:
① 包含尽可能多的灰度级
② 各灰度级尽可能的均匀分布
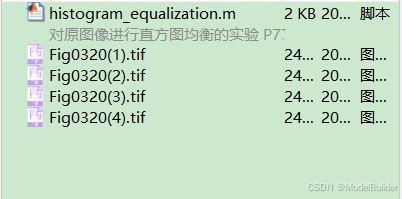
7.2 文件目录结构
7.3 Matlab代码
% 对原图像进行直方图均衡的实验 P77
close all;clear all;clc;

% 读入图片
r_2 = imread('Fig0320(1).tif');
r_3 = imread('Fig0320(2).tif');
r_4 = imread('Fig0320(3).tif');
r_1 = imread('Fig0320(4).tif');

% 直方图均衡处理
s_1 = histeq(r_1,256);
s_2 = histeq(r_2,256);
s_3 = histeq(r_3,256);
s_4 = histeq(r_4,256);

% 显示图像
figure;
subplot(4,4,1);
imshow(r_1); % 原图像显示
title('原图像');
subplot(4,4,2);
imhist(r_1); % 显示原图像的直方图
title('原图像的直方图');
subplot(4,4,3);
imshow(s_1); % 显示均衡化后的图像
title('均衡化后的图像');
subplot(4,4,4);
imhist(s_1); % 显示均衡化后图像的直方图
title('均衡化后图像的直方图');

subplot(4,4,5);
imshow(r_2); % 原图显示
subplot(4,4,6);
imhist(r_2); % 显示原图像的直方图
subplot(4,4,7);
imshow(s_2); % 显示均衡化后的图像
subplot(4,4,8);
imhist(s_2); % 显示均衡化后图像的直方图

subplot(4,4,9);
imshow(r_3); % 原图显示
subplot(4,4,10);
imhist(r_3); % 显示原图像的直方图
subplot(4,4,11);
imshow(s_3); % 显示均衡化后的图像
subplot(4,4,12);
imhist(s_3); % 显示均衡化后图像的直方图

subplot(4,4,13);
imshow(r_4); % 原图显示
subplot(4,4,14);
imhist(r_4); % 显示原图像的直方图
subplot(4,4,15);
imshow(s_4); % 显示均衡化后的图像
subplot(4,4,16);
imhist(s_4); % 显示均衡化后图像的直方图
