线性回归模型学习
社团有一个博客的任务,正好在学沐神的动手学深度学习记一下就当学习笔记吧!
线性回归
这里引用沐神的例子,假如你要买房
假设一:
你的房价可能与地理位置,大小(size),卧室个数,周围的学校等等有关。这些都是影响房价的关键因素。我们记作 x 1 , x 2 , x 3 x_1,x_2,x_3 x1,x2,x3
假设二:这样我们就可以把房价建立一个线性模型即:
y = w 1 x 1 + w 2 x 2 + w 3 x 3 + b y=w_1x_1+w_2x_2+w_3x_3+b y=w1x1+w2x2+w3x3+b
W为各个因素的权值
这样给定n维输入 x = [ x 1 , x 2 , . . . , x n ] T x=[x1,x2,...,x_n]^T x=[x1,x2,...,xn]T
输出为 y = w 1 x 1 + w 2 x 2 + . . . + w n x n + b y=w_1x_1+w_2x_2+...+w_nx_n+b y=w1x1+w2x2+...+wnxn+b
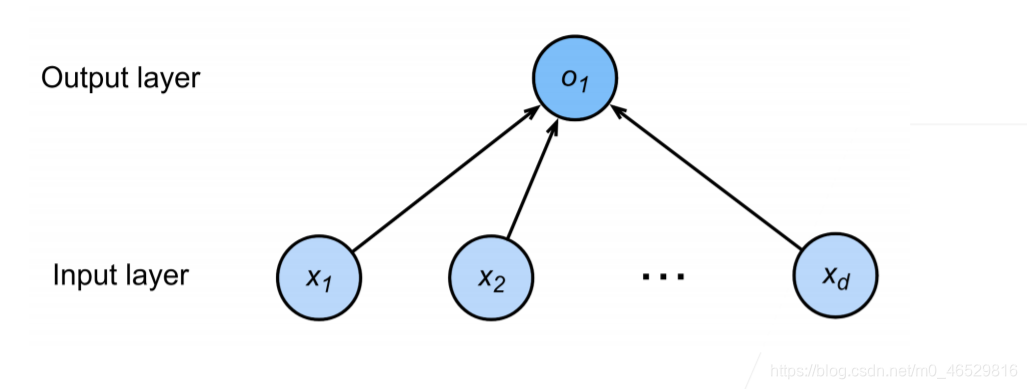
这样我们就可以把线性模型看做是单层神经网络
此图来自沐神PPT
在我看来神经网络学习就是通过网络中的每一次计算来获得输出层的预估结果。通过不断优化模型,得到最优的估计值,然而为了评判结果的好坏我们引入平方损失:
l ( y , y ^ ) = 1 / 2 ( y − y ^ ) 2 l(y,\widehat{y}) = 1/2(y-\widehat{y})^2 l(y,y
)=1/2(y−y
)2
他是用来评估预估值与真实值得一种方法。
这样我们就可以把我们模型在每一个训练数据上的损失求均值就得到了损失函数: l ( X , y , w , b ) = 1 / 2 n ∑ i = 1 n ( y i − < x i , w > − b ) 2 = 1 / 2 n ∥ y − X w − b ∥ 2 l(X,y,w,b) = 1/2n\sum_{i=1}^{n}(y_i-<x_i,w>-b)^2=1/2n\|y-Xw-b\|^2 l(X,y,w,b)=1/2ni=1∑n(yi−<xi,w>−b)2=1/2n∥y−Xw−b∥2
我们想要找到一个w和b让损失最小,这样我们想要求解的模型了。
优化算法——梯度下降
首先我们要挑选一个初始 w 0 w_0 w0
然后重复迭代参数t=1,2,3
根据高中导数知识,我们可以明白在损失函数中沿着梯度方向将增加损失函数值
这里给出公式
w t = w t − 1 − η ∗ ∂ l / ∂ w t − 1 w_t=w_{t-1}-\eta*\partial l/\partial w_{t-1} wt=wt−1−η∗∂l/∂wt−1
此处的 η \eta η为步长的超参数
有了优化方法我们就可以求解模型了。
实现代码
生成带有噪音的人造数据集
%matplotlib inline
import random
import torch
import numpy as np
from d2l import torch as d2l
下面给出线性模型的参数
w = [ 2 , − 3.4 ] ⊤ w=[2,−3.4]^⊤ w=[2,−3.4]⊤
b = 4.2 b=4.2 b=4.2
y = X w + b + c y = Xw + b +c y=Xw+b+c
数据生成函数
def synthetic_data(w,b,num_examples):
    X = torch.normal(0,1,(num_examples,len(w)))
    y = torch.matmul(X,w)+b
    y += torch.normal(0,0.01,y.shape)
    return X,y.reshape((-1,1))
true_w = torch.tensor([2,-3.4])
true_b = 4.2
features, labels = synthetic_data(true_w,true_b,1000)
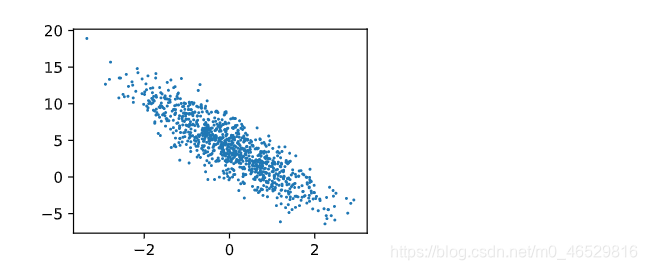
通过画图观察一下数据集
d2l.set_figsize()
d2l.plt.scatter(features[:,1].detach().numpy(),labels.detach().numpy(),1)
定义接受批量训练数据的函数
def data_iter(batch_size,features,labels):
    num_examples = len(features)
    indices = list(range(num_examples))
    random.shuffle(indices)
    for i in range(0,num_examples,batch_size):
        batch_indices = torch.tensor(indices[i:min(i+batch_size,num_examples)])
        yield features[batch_indices],labels[batch_indices]

batch_size = 10

for X,y in data_iter(batch_size,features,labels):
    print(X,'\n',y)
    break;
设置初始时模型的w和b
w = torch.normal(0,0.01,size=(2,1),requires_grad=True)
b = torch.zeros(1,requires_grad=True)
w
定义模型
def linreg(X,w,b):
    return torch.matmul(X,w) + b
定义损失函数
def squared_loss(y_hat,y):
    return (y_hat - y.reshape(y_hat.shape))**2 / 2
定义优化算法(梯度下降)
def sgd(params,lr,batch_size):
    with torch.no_grad():
        for param in params:
            param -= lr * param.grad / batch_size
            param.grad.zero_()
训练过程
lr = 0.03
num_epochs = 3
net = linreg
loss = squared_loss

for epoch in range(num_epochs):
    for X,y in data_iter(batch_size,features,labels):
        l = loss(net(X,w,b),y)

        l.sum().backward()
        sgd([w,b],lr,batch_size)
    with torch.no_grad():
        true_l = loss(net(features,w,b),labels)
        print(f'epoch {epoch+1},loss {float(true_l.mean()):f}')
比较真实参数和通过训练参数来评估训练的成功程度
print(f'w的估计误差:{true_w-w.reshape(true_w.shape)}')
print(f'b的估计误差:{true_b-b}')
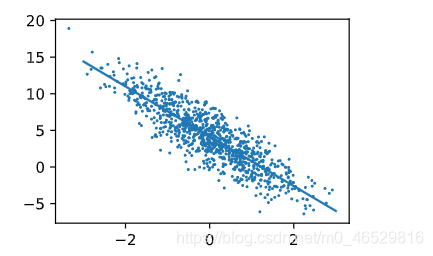
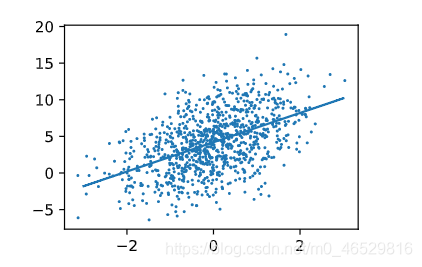
看一下效果
两个W的效果
d2l.set_figsize()
d2l.plt.scatter(features[:,1].detach().numpy(),labels.detach().numpy(),1)
xfit = np.linspace(-3,3,1000)
yfit = np.multiply(w.detach().numpy()[1],xfit)+b.detach().numpy()
d2l.plt.plot(xfit,yfit)
d2l.set_figsize()
d2l.plt.scatter(features[:,0].detach().numpy(),labels.detach().numpy(),1)
xfit = np.linspace(-3,3,1000)
yfit = np.multiply(w.detach().numpy()[0],xfit)+b.detach().numpy()
d2l.plt.plot(xfit,yfit)
最后附上沐神课程链接沐神课程链接
如有错误可以评论或者私信我,感谢阅读。


